How many stops per hour should a delivery driver make? And how to measure it
Short answer
There is no universal number: stops per hour depends on how close the stops are, how long each one takes, the delivery windows, the vehicle and the building, so a dense downtown route and a rural one cannot be compared. Measure your own stops per hour and on-time rate by route type, and compare with your own previous period. A quick estimate for one route type is 60 divided by the average minutes per stop (driving to it plus time at the stop): 4 minutes of driving and 6 at the stop gives about 6 stops an hour. That is arithmetic, not a benchmark. In Afi Planner, analytics show both for the team and for each driver.
How it works in Afi Planner
Why there is no universal number, and what drives it
The same driver gets very different results on two routes, and two companies do not run the same kind of day. A figure without route type, stop type and period is not a benchmark, so this page gives none. These are the things that move it.
- Stop density: minutes of driving between stops
- Service time: a package left at a door versus a signature, a stairwell, a dock queue, a pickup
- Delivery windows: a tight window creates waiting or a longer path, and waiting counts as route time
- Vehicle and load: capacity, loading order, parking
- Shift design: breaks, start time versus traffic, route length
- Failed attempts: a visit with no delivery still takes the time
- Plan quality: how stops are split between drivers and put in order
How Afi Planner counts stops per hour
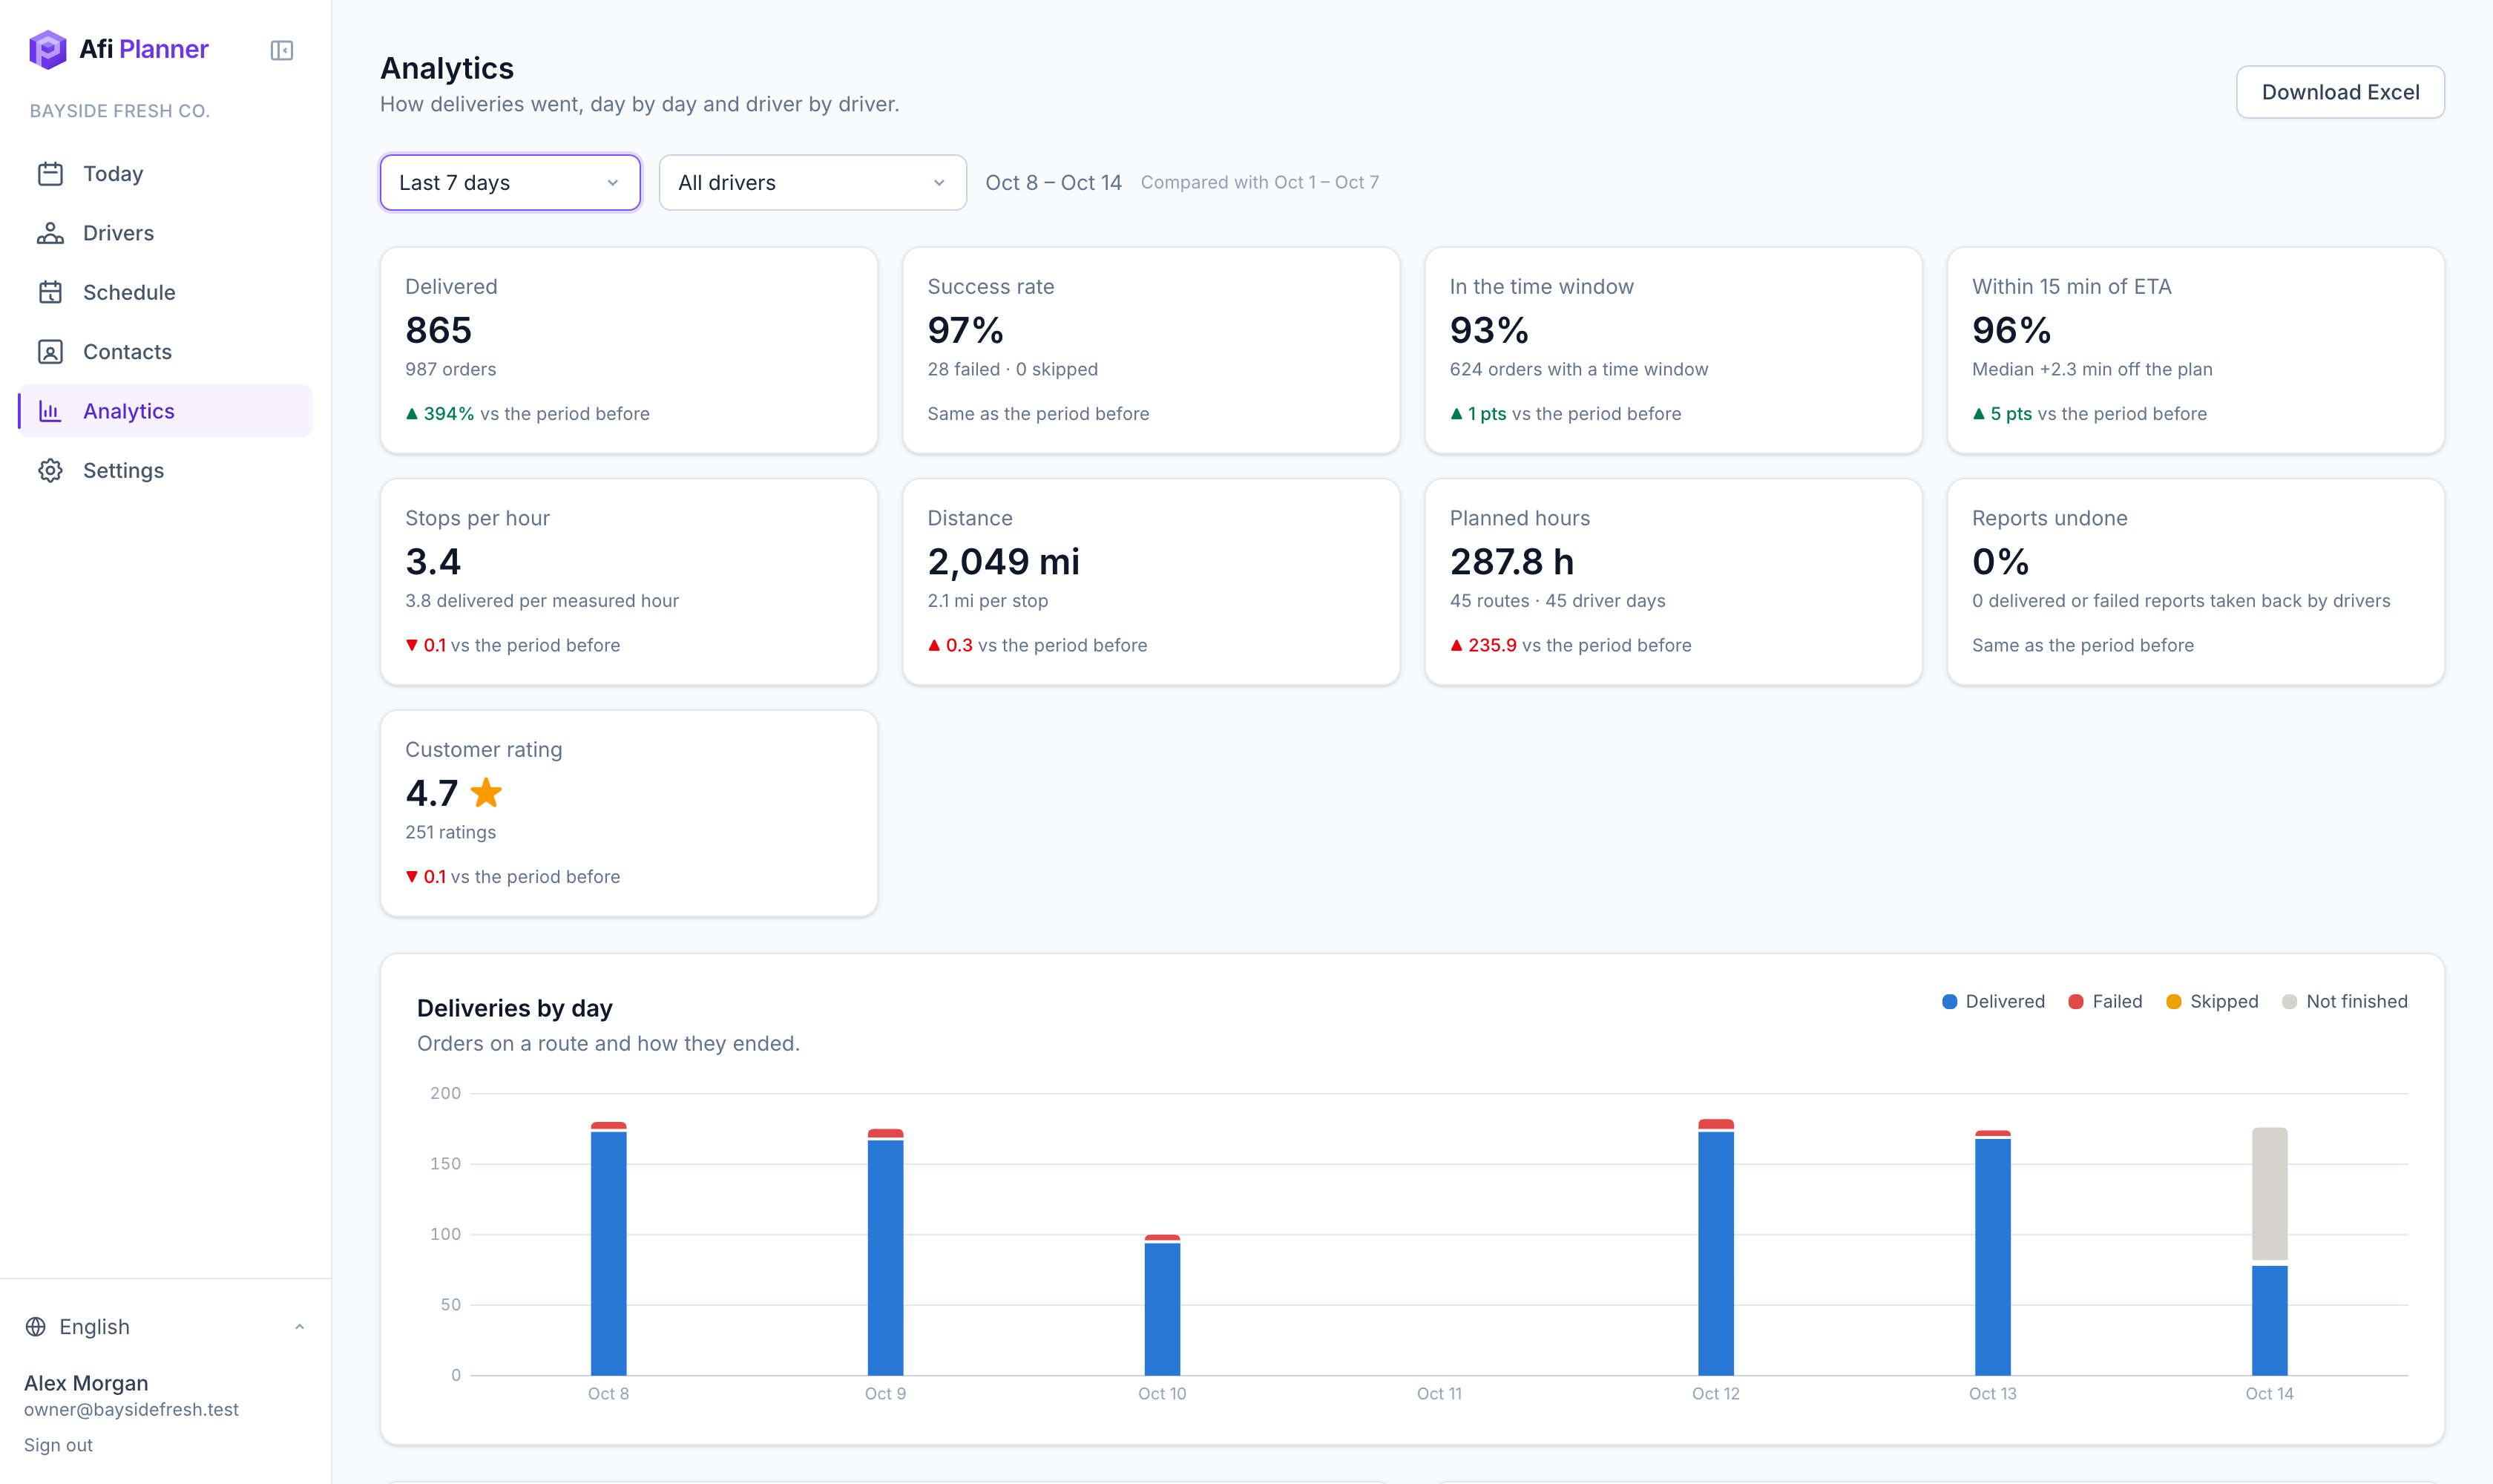
Afi Planner is route planning and delivery management software for local delivery teams, made by Afi Labs. Its analytics page shows stops per hour next to on-time rate, distance and customer rating for the whole team or one driver, and each tile is compared with the same number of days right before. The picture is the demo company, a fictional delivery company, so its numbers, such as 3.4 stops per hour, are generated demo data, not a result or a benchmark.
- Stops per hour: delivery visits on routes divided by planned route hours (route end minus route start)
- Delivered per measured hour: delivered orders divided by measured hours, only for routes the driver app reported on; measured hours run from the first to the last location point or stop event
- The planned time split of each route shows where the hours go: driving, at stops, break and waiting
Measure it together with on-time
Stops per hour alone rewards rushing. Read it next to the on-time numbers, so a faster day is not one that moved the cost to the customer.
- In the time window: delivered orders with a window whose arrival is inside the window, divided by delivered orders with a window, with no tolerance
- Within 15 min of ETA, and the median minutes off the plan
- If stops per hour rises while the in-window share falls, you did not get faster
A method that works
Compare like with like, and compare with yourself. Excel export by day, driver and order is there for payroll or a client review.
- Pick a period of two weeks to a month and keep route types apart (dense, suburban, rural; residential, business) by using the Excel export by order and grouping by your own ZIP or label
- Write down stops per hour, in-window share and failed share for each route type
- Compare each with the same route type in your previous period, and each driver with their own planned work rather than with the best driver
- Look at the time split before blaming a driver: long waiting is a window problem, long driving is a plan problem
Try it in the live demo
A fictional delivery company in the middle of its day. Read-only, no sign-up.
Open the live demo →Feature
Analytics
Delivered and failed orders, on-time rate, ETA accuracy, stops per hour and miles by day and by driver, with travel times learned from GPS and Excel export.
4 steps · 3 min read
Analytics, reports and Excel exports
Frequently asked questions
What is a good number of stops per hour?
There is no universal answer. Compare with your own previous period for the same route type, and read it with the on-time rate.
Is a higher number always better?
No. Read it with the in-window share and the failed share, or you reward rushing.
How does Afi Planner measure stops per hour?
Delivery visits on routes divided by planned route hours. “Delivered per measured hour” uses the hours the driver app reported.
Can I compare drivers?
Analytics show each driver next to their planned work, measured hours and ratings. Compare drivers on like-for-like routes.
Can I get the data out?
Yes. Analytics export to Excel by day, by driver and by order.
More answers
- How do I add new orders after my drivers have already left?
- How can I see exactly what happened on a delivery day, minute by minute?
- Is there one list of everything a dispatcher needs to act on during the day?
- Can my customers track their delivery with a live ETA and see proof of delivery?
- Does the driver app work without a signal?
- How do I import delivery orders from Excel or CSV without mixing up the dates?
- Does Afi Planner have an API with webhooks?
- How do I plan delivery routes for multiple drivers?
- How should a food and beverage distributor plan truck routes?
- How do I calculate cost per delivery stop?
- Why was a stop left off my routes? Reading unassigned-stop reasons
- What route planning software works for a courier company?
- How do I replace spreadsheet route planning? A 1-day switch plan
- How can I reduce delivery costs? A dispatcher’s checklist
- Route planner vs route optimization software: what is the difference?
- What route software supports recurring weekly deliveries to the same customers?
Plan tomorrow’s routes in minutes
Start your free 3-month trial. No credit card, no setup call, no installation.